Posterior Probability of Differential Expression (Optional)
To interpret the results of a high-throughput data experiments, it is necessary to determine the global false positive and negative levels inherent in the data set being analyzed. We have implemented a mixture-model based method described by Allison et al. [13] for the computation of the global false positive and negative levels inherent in a DNA microarray experiment [6,8]. The basic idea is to consider the p-values as a new data set and to build a probabilistic model for these new data. When control data sets are compared to one another (i.e. no differential gene expression) it is easy to see that the p-values ought to have a uniform distribution between zero and one. In contrast, when data sets from different genotypes or treatment conditions are compared to one another, a non-uniform distribution will be observed in which p-values will tend to cluster more closely to zero than one.
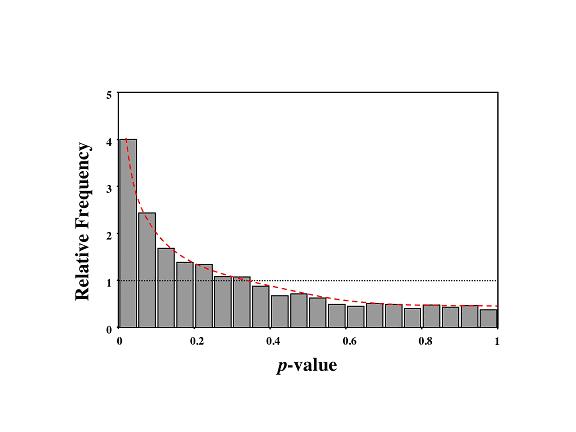
Distribution of the p-values from the lrp+ vs. lrp- data from Hung et al. [7]
The p-values, based on a regularized t-test distribution, of the 2,758 genes (lrp+ vs. lrp-) expressed at value above background in all replicate experiments grouped into 100 bins and plotted against the number of genes in each bin. The dotted line indicates the uniform distribution of p-values under conditions of no differential expression. The fitted model (dashed curve) is a mixture of a beta and the uniform distribution (dotted line).
That is, there will be a subset of differentially expressed genes with "significant" p-values. The computational method of Allison [13] is used to model this mixture of uniform and non-uniform distributions to determine the probability, PPDE(p) ranging from 0 to 1, that any gene at any given p-value is differentially expressed; that is, that it is a member of the uniform (not differentially expressed) or the non-uniform (differentially expressed) distribution. With this method, we can estimate the rates of false positives and false negatives as well as true positives and true negatives at any given p-value threshold, PPDE(<p). In other words, we can obtain a posterior probability of differential expression PPDE(p) value for each gene measurement and a PPDE(<p) value at any given p-value threshold based on the experiment-wide global false positive level and the p-value exhibited by that gene [6,8]. It should also be emphasized that this information allows us to infer the genome-wide number of genes that are differentially expressed; that is, the fraction of genes in the non-uniform distribution (differentially expressed) and the fraction of genes in the uniform distribution (not differentially expressed).